📘 Chandigarh University
These Final Examination papers are part of the official examinations of Chandigarh University,
designed to test knowledge and practical understanding of core MCA, Computer Applications, and B.Tech subjects.
💡 Each paper encourages students to think critically, apply concepts, and showcase problem-solving skills — helping them prepare for real-world IT challenges.
Usage Condition:
- 📖 Papers are for reference and study purposes only.
- 🧑🎓 Students should use them responsibly and not for any malpractice.
- 📅 Availability depends on the course and year.
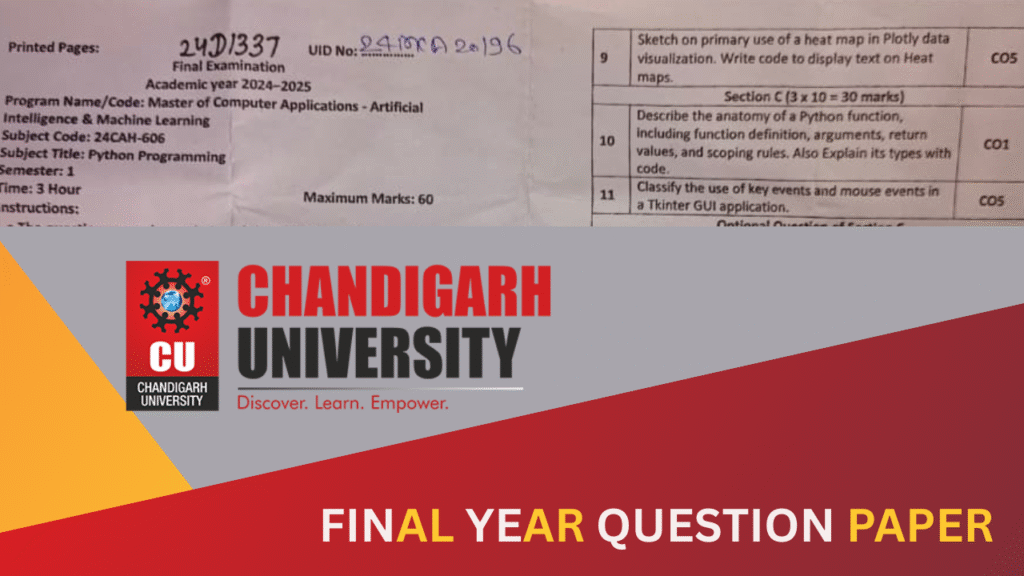
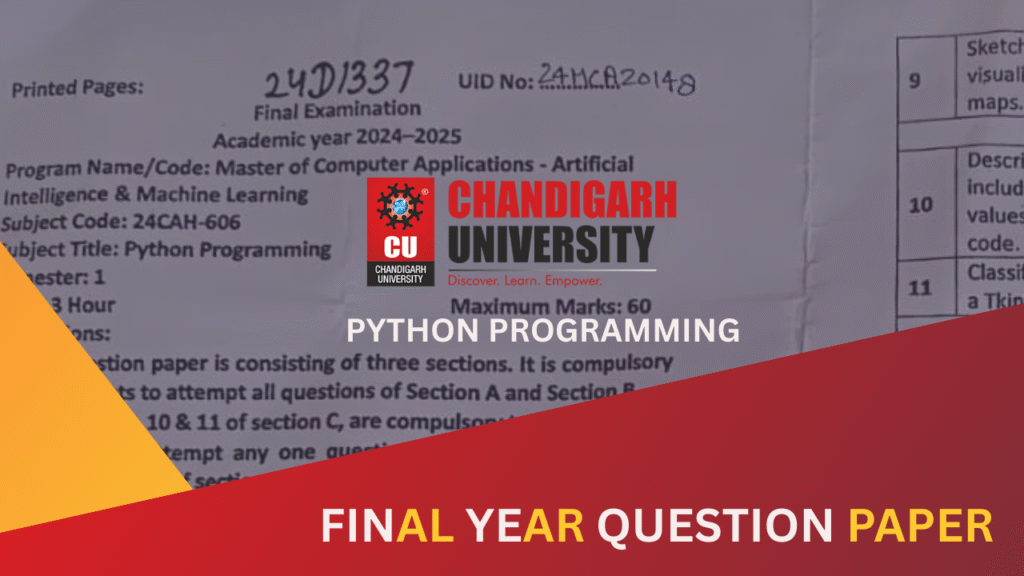
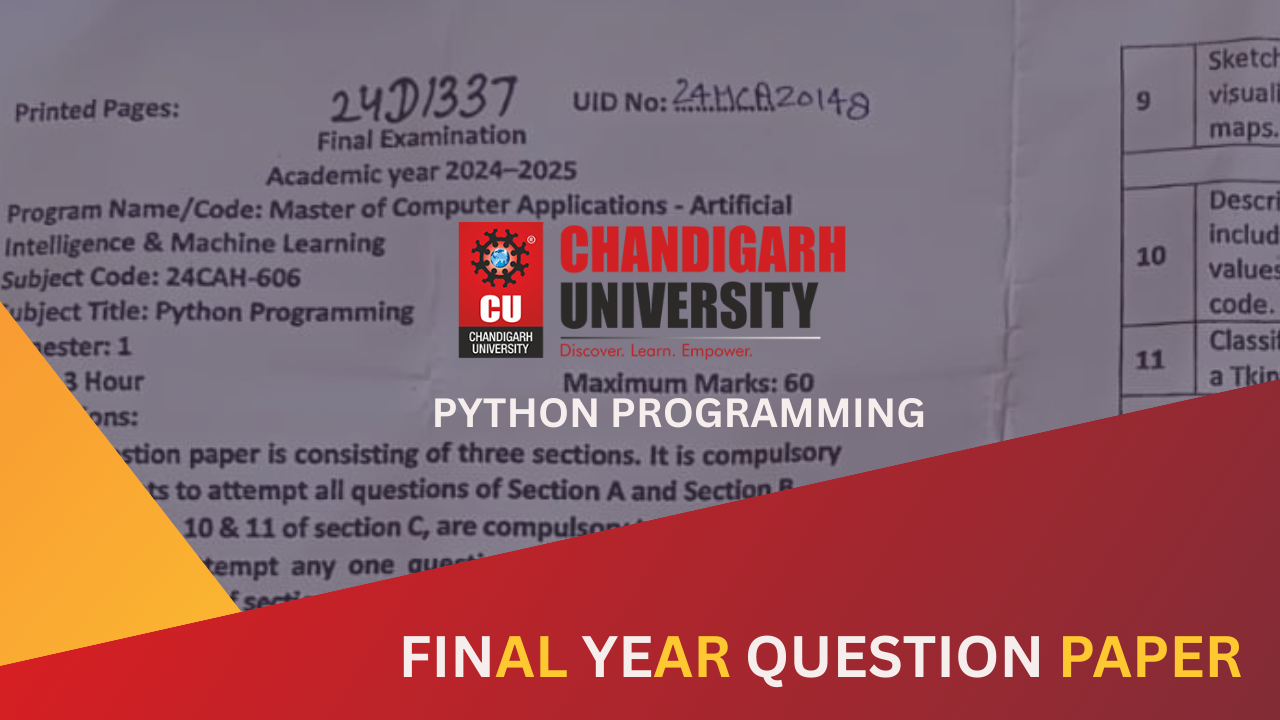
Python Programming
Subject Code: 24CAH-606
Semester: 1 | Time: 3 Hours | Max Marks: 60
Section A
(5 × 2 = 10 Marks)
- Express the role of function in Python. Illustrate default argument with the help of example. (CO1)
- Examine the purpose of a violin plot. (CO3)
- Memorize the function used to start the Tkinter event loop. Write syntax. (CO5)
- Explain the role of a geometry manager in GUI programming. (CO5)
- Explain the difference between a Canvas and a Frame in Tkinter. (CO5)
Section B
(4 × 5 = 20 Marks)
- Discuss the concept of method overloading and method overriding in Python, along with their practical applications. (CO2)
- Demonstrate the main characteristics of a box plot and its significance in data visualization. Write code to implement Box Plot. (CO4)
- Explain the purpose of the subplots() function in Matplotlib. (CO4)
- Sketch on primary use of a heat map in Plotly data visualization. Write code to display text on Heat maps. (CO5)
Section C
(3 × 10 = 30 Marks)
- Describe the anatomy of a Python function, including function definition, arguments, return values, and scoping rules. Also explain its types with code. (CO1)
- Classify the use of key events and mouse events in a Tkinter GUI application. (CO5)
- Optional Question: Explain the purpose of using a categorical plot in data visualization with the help of example. (CO5)
- OR Compare the advantages and limitations of using box plots and matrix plots in data visualization. Also write code to display Box plot and matrix plot. (CO5)
⚠️ Important Notice: When you request to download this PDF, the owner will review and allow your request. Please wait patiently for approval.